Back to Basics: Db2 z/OS Access Paths and Db2 Explain
The access paths formulated by the Db2 optimizer during the BIND process or access paths formulated at runtime for dynamic queries are critical to application performance. It is these access paths that determine how efficiently Db2 data is read and a result set delivered back.
Optimization analyses each SQL statement, the objects involved, data distribution statistics for tables involved and a few other areas to determine what it thinks is the most efficient physical path to take in the retrieval of the requested result set. Data distribution statistics is the storing of a table’s data (for example the total number of rows in a table, the cardinality of each column’s data, etc.).
The query processing engine of Db2 is generally referred to as the optimizer or the Relational Data Services (RDS) components, which does query transformation, access path selection, run time, and parallelism.
The following are some of the inputs the optimizer looks at to help in deciding an access path for a query.
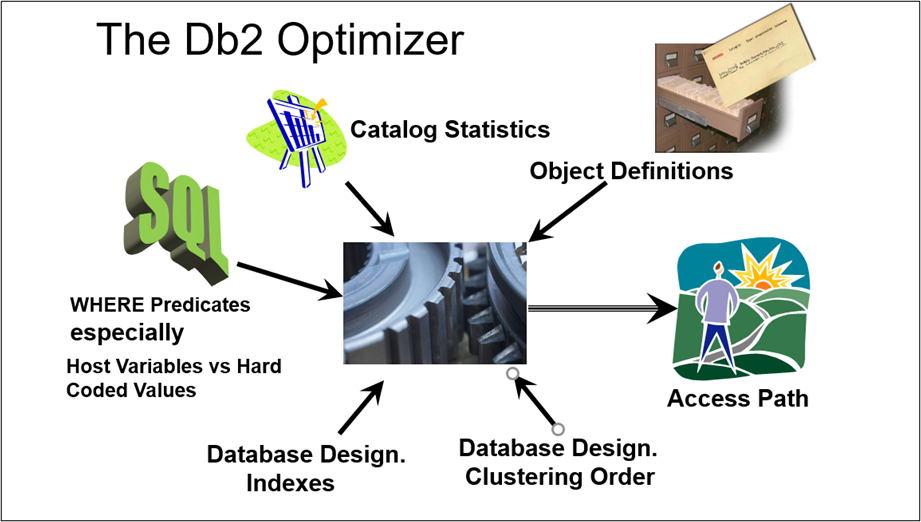
Often times for a query there may be numerous ways for Db2 to retrieve a result set. Db2 has a cost-based optimizer and evaluates the different ways to come up with ‘what it thinks’ is the least costly path to retrieving and returning the result set. This is all based on:
- Db2 tables involved
- Data distribution statistics
- Amount of data to be returned
- Indexes on tables
- SQL Code efficiencies / inefficiencies
- SQL WHERE logic
- Database table design
- Clustering order of data in the tables
The statement ‘What it Thinks’ is based on what information it has at hand to make the least cost access path choice. Is it always correct in it choice of access paths? No! Is it mostly correct? Yes!
It is hard for the optimizer to guess how much data will be returned for a query, or which index to choose from, or what order of tables to execute through, etc. It is all based on the inputs for the tables involved, especially data statistics. And for packages that get bound into a package, the optimizer is making guesses not knowing the values that will come in for host variables or parameter markers contained in the query. But for most of the inputs that the optimizer evaluates in making its choice, we as developers and DBAs have control over them.
How do you get the explanation from the Db2 optimizer on the access path chosen for a query (or set of queries within a package)? The is done via the Db2 Explain utility which will show the optimizer’s assigned access plan and estimated costs. But in order to utilize Db2 Explain, there must be explain table(s) created where the information is placed. You then read from those table(s) and evaluate the information that the optimizer has inserted into them.
The main explain table is the PLAN_TABLE. In most cases of running the Db2 Explain this is the only table that has to be created. There are many other explain tables (referenced later) that if they are created will be loaded with data also. This PLAN_TABLE contains a lot of information on a query’s access path chosen, basics like:
- Was an index chosen to use, or did it choose to table scan of all the data?
- If a table scan was chosen, is it a full table scan or page range scan (partial to specific partitions)?
- Which index or indexes were chosen?
- How many of the index columns are being used?
- What is the order of tables to be processed?
- What is the join type chosen (Nested Loop, Merge Scan, or Hybrid)?
- Is prefetch being used? Which type (List or Sequential)?
- Any parallelism selected?
- Are there any sorts being done? If so why (Order By, Group By, Join, Unique)
- What type of locking is required?
- Etc.
This article is not to delve into each of these areas in detail, but to show what information is available in describing how a query is being executed. There exists other explain tables with further information on predicates involved and costing numbers. These will also be loaded with optimizer data when an explain is executed if the tables were first created. Following are 4 of the more important ones.
- DSN_PREDICAT_TABLE: Contains information on each predicate for a query
- DSN_FILTER_TABLE: Contains more predicate information
- DSN_STATEMNT_TABLE: Estimated costing to run the query in z/OS service units and milliseconds
- DSN_DETCOST_TABLE: Contains further costing information
If you are using the IBM Data Studio visual explain tool, then you must have all the explain tables created for the Db2 version that you are on. Without all of the tables the visual explain will fail. The visual explain process reads through the data in the explain tables that were populated for a query at explain time, and presents a visual graph of the raw data from those tables. The following pages will show examples of data in the PLAN_TABLE (raw data) and its transformation into the visual graph output.
How do you run an explain? How do you see the results?
• A dynamic Explain that asks the Db2 optimizer for an explanation of specific query’s access path. This will be executed from a query tool. In most query tools you will need to follow up with queries against the explain tables in order to see and evaluate results. The IBM Data Studio visual explain will show the results instantly.
• A static Explain is one generated from a bind of a package including EXPLAIN(YES) as one of the BIND parameters. This process inserts access path information into a set of explain tables for every query in a package at the time the BIND is executed. You will need to follow up with queries against the explain tables in order to see and evaluate the results.
Following are a few examples using the Db2 set of sample tables (EMP, DEPT, PROJ, etc) that shows the raw data in the main PLAN_TABLE, and how the visual explain displays the data.
Example 1: Table scan, no index chosen. Running an explain on this query puts an ‘R’ value in the Access Type column of the PLAN_TABLE which actually stands for ‘Relation’ scan.
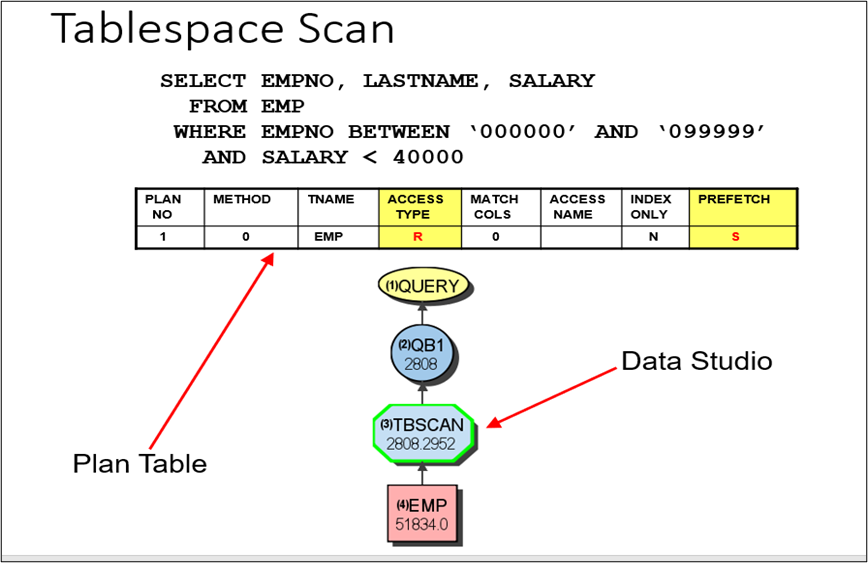
Why would the optimizer choose to scan the whole table file in order to find the rows needed? There are a number of reasons for this, and the most basic reasons are:
- There are no indexes that match the ‘Where’ criteria to take advantage of
- The amount of data the optimizer thinks will be returned is large enough to warrant a scan
- The table of data contains a small amount of data
Notice: In the visual explain output, you see a number 51,834 in the EMP table node representing the number of rows in the table from the last time data distribution statistics were generated for the table. You also see the number 2802 in the TBSCAN noting the number of rows the optimizer thinks will be returned.
Typically, anyone writing and executing queries will want to take advantage of indexes to help speed up the retrieval of the result set and not scan the complete table of data. When a table scan is found, it should raise a red flag to those evaluating the query. Sometimes scans are OK, but typically not.
Note that with the extra explain tables the IBM Data Studio visual explain requires, we see further detail and inputs into the optimization access path choice.
Example 2: Index processing. Index3 on this EMP table is a composite index made up of 3 columns (Lastname, Firstnme, Midinit). In this query, the first columns of the index are part of the ‘Where’ criteria, thus Matching Columns = 2. Indexes have multiple purposes and one purpose is to assist in the gathering of requested rows for a query which typically improves a query’s performance.
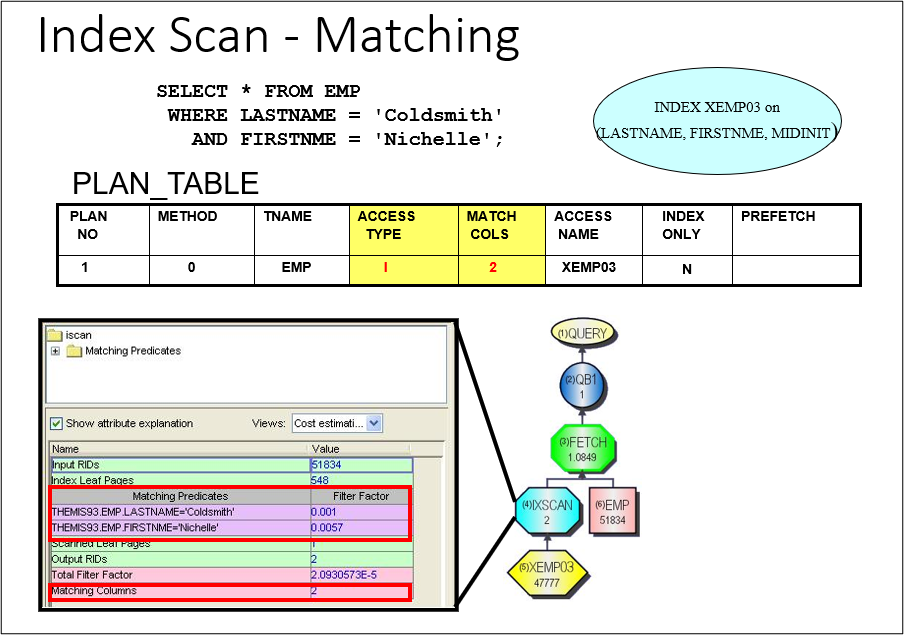
Note: Access Type ‘I’ for index chosen for processing.
Access Name: Which index was chosen, XEMP03
Matching Columns 2: Represents the number of values the index processing uses in probing the
index file to find any ‘Coldsmith’, ‘Nichelle’ rows.
47777: The number of LASTNAME, FIRSTNME, MIDINIT unique combinations. They represent 1
entry each in the index file, along with row identifier(s) where the row lives in the
table.
IXSCAN 2: Represents the number of entries the optimizer thinks will meet the ‘Where’ criteria of
LASTNAME=’Coldsmith’ and FIRTSNME=’Nichelle’.
Example 3: Join Processing. In Db2 z/OS, the optimizer has 3 choices on how it’s going to execute a join and process its checking of values between tables. If it chooses to execute the join via a Nested Loop Join, it puts a ‘1’ in the PLAN_TABLE method column, ‘2’ if executing a Merge Scan join, and ‘3’ for the Hybrid Join processing. The order of tables will be assigned by the plan number, and the table with Method ‘0’ is always the starting table. Visual explain graphs read left to right, bottom upward.
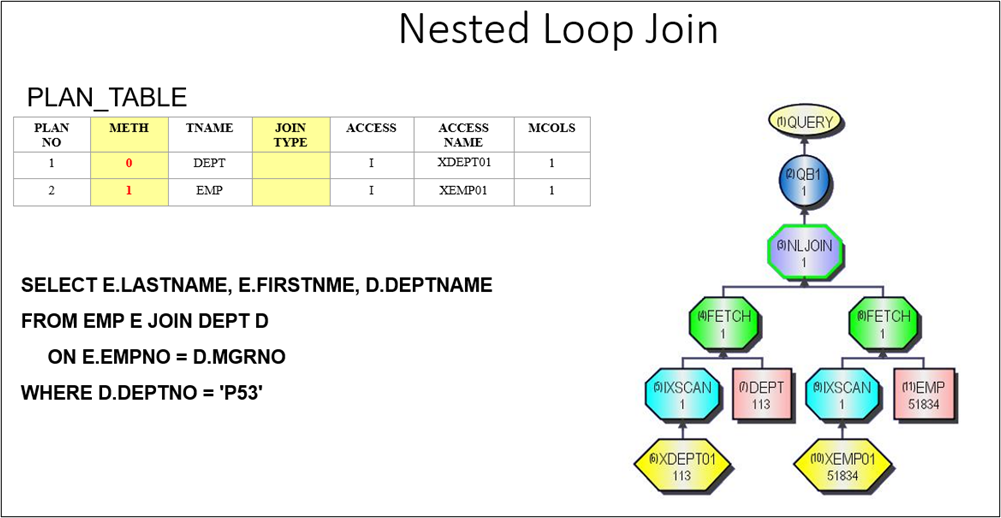
Note: Method 0 represents the starting table.
Method 1 represents a ‘Nested Loop Join’ from starting table to this table.
DEPT 113: Table node with number of rows in table as of the last time distribution statistics
were gathered for the table.
EMP 51834: Table node with number of rows in table as of the last time distribution statistics
were gathered for the table.
IXSCAN 1: Left side represents 1 row in XDEPT01 index where DEPTNO=’P53’. A department
only has 1 manager, and as the nested loop process takes place (left to right) the
other IXSCAN 1 on the right side states only 1 row to be returned based on
D.MGRNO = E.EMPNO.
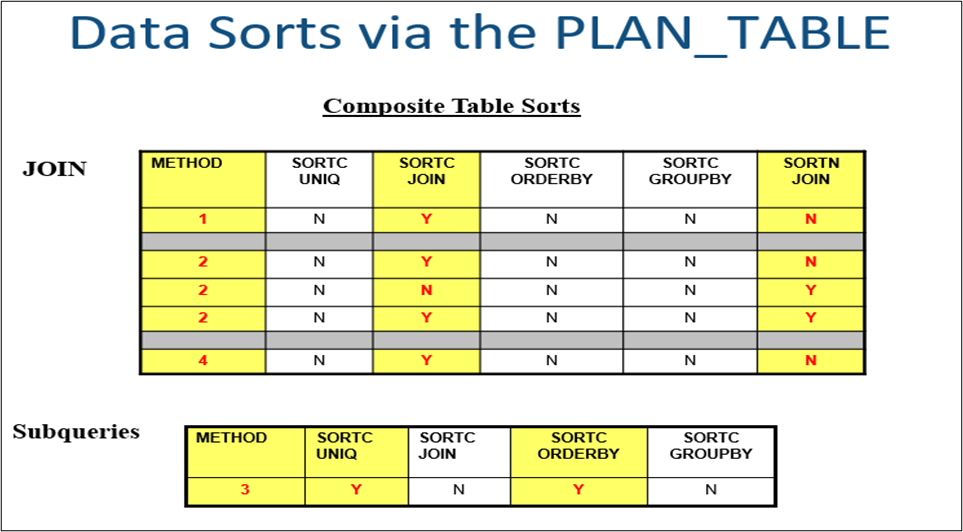
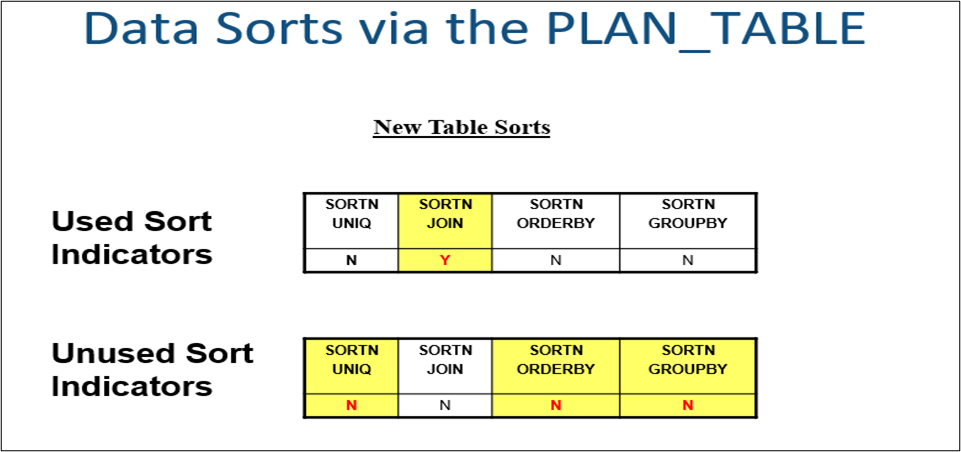
Example 4: Data Sorts. Physical data sorts may occur in the processing of a result set. SQL code that may cause the sorting of data (Order By, Group By, Distinct, Union, Non Correlated Subqueries, and sometimes in a Join). The only SQL code where a sort will execute for sure is the UNION. For the others the optimizer may or may not execute a sort, and the only to know for sure is by executing an Explain of the query and looking for ‘Y’ in one or more of the sort fields.
When seeing the SORT node in the visual explain, by putting the mouse pointer on the node, it will state the reason for the sort and the cardinality. The cardinality is a guesstimate from the optimizer on how many rows will be sorted.
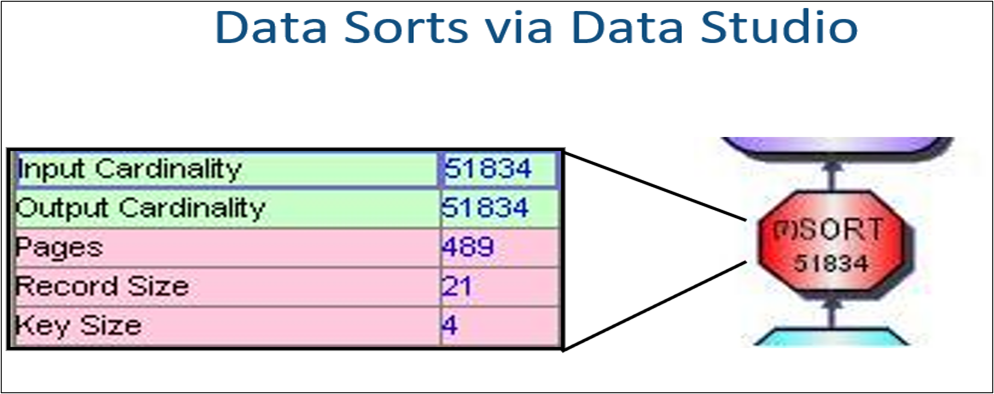
SORT 51834: States the number of result set rows the optimizer thinks will go into a sort. By placing the mouse on this node, it will state the reason for the sort based on the value ‘Y’ in any of the sort columns in the PLAN_TABLE.
Conclusion:
This article is a jumpstart to query optimization. There is much more to read and understand from the PLAN_TABLE and all the other explain tables. The DSN_PREDICAT_TABLE list the predicates in the SQL statement and information on each. Some of the information will state which predicates are being applied at each step (index or data) along with the ‘filter factor’ of each. This is a number calculated from the optimizer stating the percentage of rows it thinks each predicate will return.
There are many areas in the execution of dynamic queries and queries in packages that may cause performance issues. Understanding how to do an explain and the deciphering of the output is one of the key skills for anyone who often codes up queries. This is typically the first step in performance tuning to first see what is happening at runtime for a query. The second step is having good SQL coding skills and practices. The way queries are coded can have a huge impact on the choices or lack of choices the optimizer may have. See the following presentation on SQL Tuning
Tips
Following is a list of the explain tables (as of V12) taken from the IBM manual. All must be created if executing a Db2 explain using the IBM Data Studio tool.
• PLAN_TABLE
The plan table, PLAN_TABLE, contains information about access paths that is collected from the results of EXPLAIN statements.
• DSN_COLDIST_TABLE
The column distribution table contains non-uniform column group statistics that are obtained dynamically by Db2 from non-index leaf pages.
• DSN_DETCOST_TABLE
The detailed cost table, DSN_DETCOST_TABLE, contains information about detailed cost estimation of the mini-plans in a query.
• DSN_FILTER_TABLE
The filter table, DSN_FILTER_TABLE, contains information about how predicates are used during query processing.
• DSN_FUNCTION_TABLE
The function table, DSN_FUNCTION_TABLE, contains descriptions of functions that are used in specified SQL statements.
• DSN_KEYTGTDIST_TABLE
The key-target distribution table contains non-uniform index expression statistic that are obtained dynamically by the Db2 optimizer.
• DSN_PGRANGE_TABLE
The page range table, DSN_PGRANGE_TABLE, contains information about qualified partitions for all page range scans in a query.
• DSN_PGROUP_TABLE
The parallel group table, DSN_PGROUP_TABLE, contains information about the parallel groups in a query.
• DSN_PREDICAT_TABLE
The predicate table, DSN_PREDICAT_TABLE, contains information about all of the predicates in a query. It is also used as input when you issue a BIND QUERY command to override predicate selectivities for matching SQL statements.
• DSN_PREDICATE_SELECTIVITY table
The predicate selectivity table contains information about the selectivity of predicates that are used for access path selection. It is used as an input table for the BIND QUERY command when selectivity overrides are specified.
• DSN_PTASK_TABLE
The parallel tasks table, DSN_PTASK_TABLE, contains information about all of the parallel tasks in a query.
• DSN_QUERYINFO_TABLE
The query information table, DSN_QUERYINFO_TABLE, contains information about the eligibility of query blocks for automatic query rewrite, information about the materialized query tables that are considered for eligible query blocks, reasons why ineligible query blocks are not eligible, and information about acceleration of query blocks.
• DSN_QUERY_TABLE
The query table, DSN_QUERY_TABLE, contains information about a SQL statement, and displays the statement before and after query transformation.
• DSN_SORTKEY_TABLE
The sort key table, DSN_SORTKEY_TABLE, contains information about sort keys for all of the sorts required by a query.
• DSN_SORT_TABLE
The sort table, DSN_SORT_TABLE, contains information about the sort operations required by a query.
• DSN_STATEMENT_CACHE_TABLE
The statement cache table, DSN_STATEMENT_CACHE_TABLE, contains information about the SQL statements in the statement cache, information captured as the results of an EXPLAIN STATEMENT CACHE ALL statement.
• DSN_STATEMNT_TABLE
The statement table, DSN_STATEMNT_TABLE, contains information about the estimated cost of specified SQL statements.
• DSN_STAT_FEEDBACK
The DSN_STAT_FEEDBACK table contains recommendations for capturing missing or conflicting statistics that are defined during EXPLAIN.
• DSN_STRUCT_TABLE
The structure table, DSN_STRUCT_TABLE, contains information about all of the query blocks in a query.
• DSN_VIEWREF_TABLE
The view reference table, DSN_VIEWREF_TABLE, contains information about all of the views and materialized query tables that are used to process a query.
One last note: There are and have been different query tools for Db2 databases, but many do not have Db2 Explain functionality. The IBM Data Studio has been around for awhile with many upgrades and ‘bug fixes'. This tool has been my personal favorite due to its detail and ease of reading through a visual explain output. It also contains a great tool for coding, testing, and deploying SQL PL stored procedure coding.
There had been mention that IBM data Studio was to be replaced by IBM Data Server Manager but that has been replaced by Data Management Console (which is the next generation of Data Server Manager).
It now looks like Data Studio will eventually be replaced by two things:
DBA = Data Administration Foundation for z/OS
Developer = VSCode IBM Db2 Developer Extension for z/OS