The Book of Db2 Pacemaker Chapter 6 – Pacemaker Log: Everything, Everywhere, All at Once
You are preparing to leave Friday afternoon, maybe a little early to beat traffic to the cottage. You do one last health check on your cluster, and everything is looking good. From the Pacemaker perspective, the primary is running on <host1>, while the database on <host2> is standby. You close your laptop and head home.
After a quiet weekend, Monday morning arrives and your first TODO is to change a configuration on the database, but what’s this? The primary database is now running on <host2>, what happened?
Your first reaction might be to collect db2support + db2cm -dump from both hosts and open a ticket. After all, you need to get the data in front of IBM A.S.A.P. so they have time perform root cause analysis, and suggest a solution before the long weekend (which begins your week long vacation out of the country.
If only you could have a Db2 analyst on your team, who could save you the trouble of going through the whole support process. Well, this post is the right place to start for a high-level introduction to performing your own root cause analysis! In this post I will review two key concepts for reviewing the Pacemaker logs and include a simple example reviewing the raw pacemaker.log. Even in cases where you can’t avoid a support engagement, by being able to provide your own analysis up front will help Db2 support make quick progress on your ticket.
The Pacemaker log
The Pacemaker log (/var/log/pacemaker/pacemaker.log) is the diagnostic when it comes to understanding when, why, and how a Pacemaker cluster detected an issue, and automated the resources to bring the cluster back into an operational state. There is one Pacemaker log per host, and it usually requires looking at each host to understand the full picture of what happened.
Important: It is strongly suggested to configure NTP or Chrony to ensure the timestamps in the Pacemaker logs are consistent between the hosts.
What logs to the Pacemaker log?
The Pacemaker log will contain a lot of information but can be broadly split into two categories.
- The Pacemaker software itself (the 7 daemons.)
- The Pacemaker resource agents.
Of the 7 daemons, pacemaker-schedulerd, and pacemaker-controld will generally tell you what Pacemaker’s view of the current state of the cluster is, as well as what it is currently executing and what it plans to do next. Most of this information is available on the host which is the cluster’s ‘Designated Controller’ host.
The resource agents on the other hand, will log information regarding the actions executed by the cluster manager on the host that they were executed. For example, Pacemaker will run the db2hadr resource agent to monitor the HADR database, and that resource agent will log to the Pacemaker log on the host it was executed on.
With the above in mind, it leads to two key concepts that must be understood to effectively perform root cause analysis.
Key Concept #1: Where to find what I am looking for?
The first concept is understanding where to look for specific diagnostics. It is important to know that all decision making is done and logged on the DC (designated controller) host. Meanwhile the resource agents themselves, which are responsible for starting/stopping/monitoring various resources, all log to the Pacemaker log on the host in which they were executed via pacemaker-execd.
Given that either host could play home to the designated controller, or the primary database, the Pacemaker log on either individual host could look very different for the exact same failure scenario.
For example, if you are investigating an unplanned takeover in an automated HADR cluster, you will want to understand why the original primary was monitored offline. Generally, an unplanned outage of a primary database can be split into 3 parts.
1) Monitor of Primary database fails for some reason.
2) Pacemaker calculates a course of action to bring primary back online.
3) Pacemaker executes the planned actions, bringing the primary back online. (Restart or Takeover)
If `Host-1` was the original primary database host, and is also the DC host, then you can expect the pacemaker.log on `Host-1` to contain diagnostics on both the primary monitor failure (from the resource agent), as well as diagnostics on Pacemaker's reaction to that failure from pacemaker-schedulerd (1 & 2). Meanwhile on `Host-2` you can expect to see the db2hadr resource agent logging diagnostics regarding the `takeover` command being run on the standby (3).
Alternatively, if the standby host (`Host-2`) was the DC host, then you can expect (1) to be logged on `Host-1`, and (2 & 3) to be logged on `Host-2`. It's important to note that in HADR clusters, a failure of the primary database does not always result in takeover, so it is important to check the log and understand what Pacemaker decided to do to bring the cluster back online.
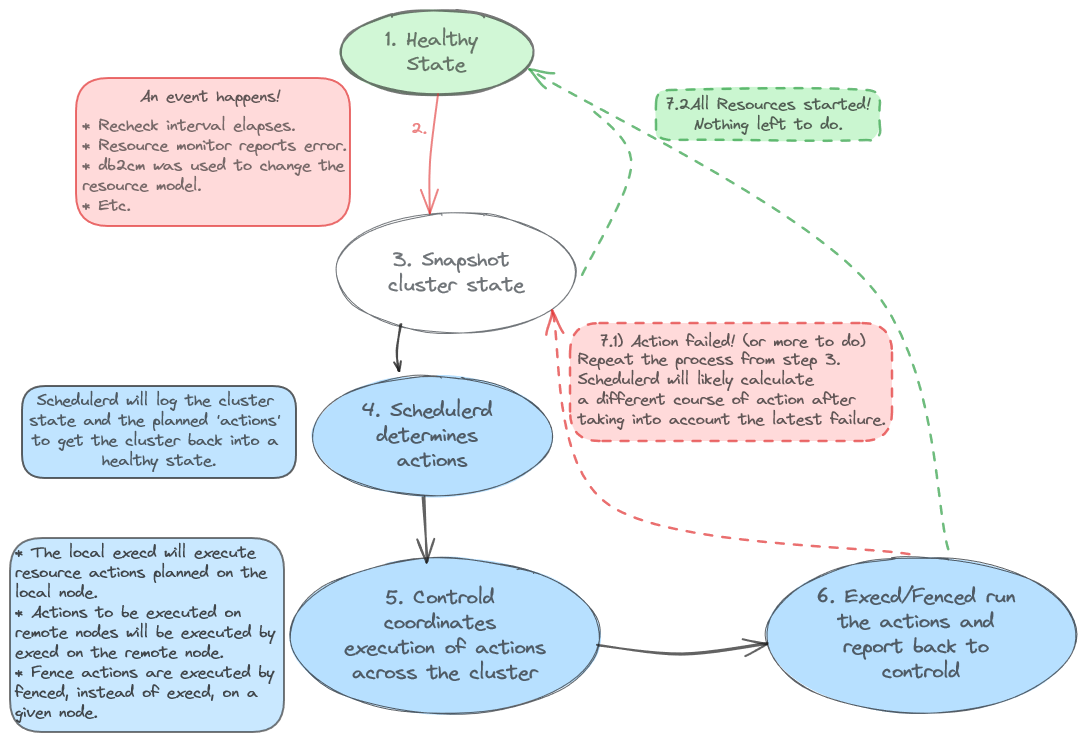
Key Concept #2: The Pacemaker decision-making process.
The second concept is Pacemaker's general event loop as seen from the log. On the designated controller host, the log will 'loop' through the following states.
Key concepts in action: An Example
This example will work through a simulated software failure via killing the db2sysc process on the primary database host.
Initial cluster state
From `crm status`, we can see which host has the primary database role, as well as the designated controller.
[root@host-srv-1 ~]# crm status
Cluster Summary:
* Stack: corosync
* Current DC: host-srv-2 (version 2.1.2-4.db2pcmk.el8-ada5c3b36e2) - partition with quorum
* Last updated: Fri Oct 20 07:00:33 2023
* Last change: Mon Oct 16 07:00:21 2023 by root via crm_attribute on host-srv-2
* 2 nodes configured
* 6 resource instances configured
Node List:
* Online: [ host-srv-1 host-srv-2 ]
Full List of Resources:
* db2_host-srv-1_eth0 (ocf::heartbeat:db2ethmon): Started host-srv-1
* db2_host-srv-2_eth0 (ocf::heartbeat:db2ethmon): Started host-srv-2
* db2_host-srv-1_db2inst1_0 (ocf::heartbeat:db2inst): Started host-srv-1
* db2_host-srv-2_db2inst1_0 (ocf::heartbeat:db2inst): Started host-srv-2
* Clone Set: db2_db2inst1_db2inst1_HADRDB-clone [db2_db2inst1_db2inst1_HADRDB] (promotable):
* Masters: [ host-srv-1 ]
* Slaves: [ host-srv-2 ]
From the above, host-srv-2 is the designated controller, and host-srv-1 is currently the primary database host. Of course, when investigating a failure that happened, you will not have the opportunity to run `crm status` before the failure occurs.
Luckily, you should have a rough idea of when the failure occurred, and the same information can be obtained by searching for pacemaker-schedulerd log entries that come before the failure.
The following is an annotated example of pacemaker-schedulerd's output to the log when the cluster is in a healthy state. The healthy state corresponds to state `1` and `2` mentioned 'Pacemaker event loop' section above.
// REF 1 – The event.
Oct 20 07:15:47.296 host-srv-2 pacemaker-controld [1234] (crm_timer_popped) info: Cluster Recheck Timer just popped | input=I_PE_CALC time=60000ms
Oct 20 07:15:47.296 host-srv-2 pacemaker-controld [1234] (do_state_transition) notice: State transition S_IDLE -> S_POLICY_ENGINE | input=I_PE_CALC cause=C_TIMER_POPPED origin=crm_timer_popped
Oct 20 07:15:47.296 host-srv-2 pacemaker-controld [1234] (do_state_transition) info: Progressed to state S_POLICY_ENGINE after C_TIMER_POPPED
// REF 2 – Host status information.
Oct 20 07:15:47.319 host-srv-2 pacemaker-schedulerd[1233] (determine_online_status) info: Node host-srv-2 is online
Oct 20 07:15:47.319 host-srv-2 pacemaker-schedulerd[1233] (determine_online_status) info: Node host-srv-1 is online
Oct 20 07:15:47.325 host-srv-2 pacemaker-schedulerd[1233] (pcmk__set_instance_roles) info: Promoting db2_db2inst1_db2inst1_HADRDB:1 (Master host-srv-1)
Oct 20 07:15:47.325 host-srv-2 pacemaker-schedulerd[1233] (pcmk__set_instance_roles) info: db2_db2inst1_db2inst1_HADRDB-clone: Promoted 1 instances of a possible 1
// REF 3 – Resource status & planned actions.
Oct 20 07:15:47.326 host-srv-2 pacemaker-schedulerd[1233] (rsc_action_default) info: Leave db2_host-srv-1_eth0 (Started host-srv-1)
Oct 20 07:15:47.326 host-srv-2 pacemaker-schedulerd[1233] (rsc_action_default) info: Leave db2_host-srv-2_eth0 (Started host-srv-2)
Oct 20 07:15:47.326 host-srv-2 pacemaker-schedulerd[1233] (rsc_action_default) info: Leave db2_host-srv-1_db2inst1_0 (Started host-srv-1)
Oct 20 07:15:47.326 host-srv-2 pacemaker-schedulerd[1233] (rsc_action_default) info: Leave db2_host-srv-2_db2inst1_0 (Started host-srv-2)
Oct 20 07:15:47.326 host-srv-2 pacemaker-schedulerd[1233] (rsc_action_default) info: Leave db2_db2inst1_db2inst1_HADRDB:0 (Slave host-srv-2)
Oct 20 07:15:47.326 host-srv-2 pacemaker-schedulerd[1233] (rsc_action_default) info: Leave db2_db2inst1_db2inst1_HADRDB:1 (Master host-srv-1)
Oct 20 07:15:47.326 host-srv-2 pacemaker-schedulerd[1233] (pcmk__log_transition_summary) notice: Calculated transition 5778, saving inputs
// REF 4 – Indicates no action to be taken.
Oct 20 07:15:47.326 host-srv-2 pacemaker-schedulerd[1233] (handle_pecalc_op) info: Input has not changed since last time, not saving to disk
We can tell that host-srv-2 was the designated controller at the given timestamp for two reasons. The first is because pacemaker-schedulerd is logging to the Pacemaker log on this node and the second is because we see both hosts are online. Note that there is a case where the cluster hosts lose contact with each other, in which pacemaker-schedulerd will also be logging on the non-DC host.
REF 1: Shows the ‘event’ the cluster is responding to which is the cluster-recheck interval elapsed. This is not in response to an error, rather it is a check performed every minute.
REF 2: Shows the current state of the cluster nodes (quorum state), both nodes are online.
REF 3: Current state and planned actions for the cluster resources. In the healthy state there are no planned actions as all resources/hosts are online. We can additionally tell that the database primary was on host-srv-1, while the standby was on host-srv-2.
REF 4: Again, the cluster has no planned actions.
After the kill, what to expect?
Given that the primary instance was killed on host-srv-1, and host-srv-2 was the DC host, we can expect the following.
1. The failure will be detected and logged by the db2inst/db2hadr resource agents on host-srv-
2. The pacemaker-schedulerd daemon will calculate the proper course of action which will be logged in host-srv-2's Pacemaker log.
3. Depending on the course of action, we should either see:
-
- The primary gets reactivated on host-srv-1.
- Takeover get issued on host-srv-2, original primary gets reintegrated as standby on host-srv-1.
4. Regardless of the action chosen for step 3 above, we should also see Pacemaker bring the Db2 instance back online on host-srv-1.
Let’s kill the db2sysc process on host-srv-1 with the primary database to simulate a crash, and see how Pacemaker reacts!
Pacemaker detects the failure.
The failure happened on host-srv-1, so we examine the pacemaker log on that host.
Oct 20 10:08:36 db2inst(db2_host-srv-1_db2inst1_0)[673764]: WARNING: monitor: 681: ps did not list any process for db2sysc on node 0 after 5 retries. db2inst_monitor() exit with rc=7.
Oct 20 10:08:36.664 host-srv-1 pacemaker-attrd [1242] (attrd_peer_update) notice: Setting db2inst-host-srv-1_db2inst1_0[host-srv-1]: 1 -> 0 | from host-srv-1
Here we can see that the db2inst resource agent detects that instance is no longer running and return rc=7, which maps to OCF_NOT_RUNNING, which is then acknowledged by pacemaker-controld. (See the Pacemaker Administration documentation for a list of defined return codes.)
Remember that it is entirely possible that the db2hadr resource agent detects the failure before the db2inst resource agent depending on the timing. This will generally affect how pacemaker-schedulerd calculates the cluster state and following actions after a failure. Therefore, some variance in the contents of the logs in this failure scenario is expected.
The pacemaker-schedulerd daemon calculates the course of action.
Below is the annotated log output from pacemaker-schedulerd on host-srv-2 showing the current cluster state, and planned actions to resolve the failure.
These logs correspond to steps 3/4 in the pacemaker event loop discussed above.
// REF 1 – pacemaker-controld reacting to the failure.
Oct 20 10:08:36.665 host-srv-1 pacemaker-controld [1244] (log_executor_event) notice: Result of monitor operation for db2_host-srv-1_db2inst1_0 on host-srv-1: not running | CIB update 52, graph action unconfirmed; call=28 key=db2_host-srv-1_db2inst1_0_monitor_10000 rc=7
Oct 20 10:08:36.672 host-srv-2 pacemaker-controld [1234] (abort_transition_graph) info: Transition 5963 aborted by status-1-last-failure-db2_host-srv-1_db2inst1_0.monitor_10000 doing create last-failure-db2_host-srv-1_db2inst1_0#monitor_10000=1697821716: Transient attribute change | cib=1.160.40 source=abort_unless_down:314 path=/cib/status/node_state[@id='1']/transient_attributes[@id='1']/instance_attributes[@id='status-1'] complete=true
// REF 2 – Host status.
Oct 20 10:08:36.737 host-srv-2 pacemaker-schedulerd[1233] (determine_online_status) info: Node host-srv-2 is online
Oct 20 10:08:36.737 host-srv-2 pacemaker-schedulerd[1233] (determine_online_status) info: Node host-srv-1 is online
// REF 3 – Informational lines indicating what Pacemaker is reacting to.
Oct 20 10:08:36.740 host-srv-2 pacemaker-schedulerd[1233] (pe_get_failcount) info: db2_host-srv-1_db2inst1_0 has failed 1 times on host-srv-1
Oct 20 10:08:36.741 host-srv-2 pacemaker-schedulerd[1233] (pe_get_failcount) info: db2_host-srv-1_db2inst1_0 has failed 1 times on host-srv-1
Oct 20 10:08:36.741 host-srv-2 pacemaker-schedulerd[1233] (pe_get_failcount) info: db2_host-srv-1_db2inst1_0 has failed 1 times on host-srv-1
Oct 20 10:08:36.741 host-srv-2 pacemaker-schedulerd[1233] (pe_get_failcount) info: db2_host-srv-1_db2inst1_0 has failed 1 times on host-srv-1
Oct 20 10:08:36.741 host-srv-2 pacemaker-schedulerd[1233] (pe_get_failcount) info: db2_host-srv-1_db2inst1_0 has failed 1 times on host-srv-1
Oct 20 10:08:36.741 host-srv-2 pacemaker-schedulerd[1233] (unpack_rsc_op_failure) warning: Unexpected result (not running) was recorded for monitor of db2_host-srv-1_db2inst1_0 on host-srv-1 at Oct 20 10:08:36 2023 | rc=7 id=db2_host-srv-1_db2inst1_0_last_failure_0
Oct 20 10:08:36.743 host-srv-2 pacemaker-schedulerd[1233] (pcmk__native_allocate) info: Resource db2_db2inst1_db2inst1_HADRDB:1 cannot run anywhere
// REF 4 – Pacemaker state information . . .
Oct 20 10:08:36.744 host-srv-2 pacemaker-schedulerd[1233] (pcmk__set_instance_roles) info: Promoting db2_db2inst1_db2inst1_HADRDB:0 (Slave host-srv-2)
Oct 20 10:08:36.744 host-srv-2 pacemaker-schedulerd[1233] (pcmk__set_instance_roles) info: db2_db2inst1_db2inst1_HADRDB-clone: Promoted 1 instances of a possible 1
Oct 20 10:08:36.744 host-srv-2 pacemaker-schedulerd[1233] (RecurringOp) info: Start recurring monitor (10s) for db2_host-srv-1_db2inst1_0 on host-srv-1
Oct 20 10:08:36.744 host-srv-2 pacemaker-schedulerd[1233] (RecurringOp) info: Start recurring monitor (9s) for db2_db2inst1_db2inst1_HADRDB:0 on host-srv-2
Oct 20 10:08:36.744 host-srv-2 pacemaker-schedulerd[1233] (RecurringOp) info: Cancelling action db2_db2inst1_db2inst1_HADRDB:0_monitor_10000 (Slave vs. Master)
// REF 5 – Beginning of resource information
Oct 20 10:08:36.744 host-srv-2 pacemaker-schedulerd[1233] (rsc_action_default) info: Leave db2_host-srv-1_eth0 (Started host-srv-1)
Oct 20 10:08:36.744 host-srv-2 pacemaker-schedulerd[1233] (rsc_action_default) info: Leave db2_host-srv-2_eth0 (Started host-srv-2)
// REF 6 – Pacemaker plans to recover the db2inst1 DBM process on host-srv-1
Oct 20 10:08:36.744 host-srv-2 pacemaker-schedulerd[1233] (log_list_item) notice: Actions: Recover db2_host-srv-1_db2inst1_0 ( host-srv-1 )
Oct 20 10:08:36.744 host-srv-2 pacemaker-schedulerd[1233] (rsc_action_default) info: Leave db2_host-srv-2_db2inst1_0 (Started host-srv-2)
// REF 7 – Pacemaker plans to stop the primary database & promote (via takeover) the standby database.
Oct 20 10:08:36.744 host-srv-2 pacemaker-schedulerd[1233] (log_list_item) notice: Actions: Promote db2_db2inst1_db2inst1_HADRDB:0 ( Slave -> Master host-srv-2 )
Oct 20 10:08:36.744 host-srv-2 pacemaker-schedulerd[1233] (log_list_item) notice: Actions: Stop db2_db2inst1_db2inst1_HADRDB:1 ( Master host-srv-1 ) due to node availability
REF 1: Shows pacemaker-controld on host-srv-2 (DC host) acknowledging the failure on host-srv-1. As a result, pacemaker-schedulerd will calculate what action needs to be taken to recover resources.
REF 2: Both nodes are still online as expected for a software kill.
REF 3: Informational lines indicating what the cluster is reacting to.
REF 4: These lines instead indicate some internal Pacemaker value update for the 'master', 'slave' resources, and are not entirely useful for RCA.
REF 5: Indicates the Ethernet resources are healthy and no planned changes for these resources.
REF 6: Indicates that db2inst1 will be recovered on host-srv-1. Note that the 'Recover' action means Pacemaker will attempt to stop and then start the instance via the db2inst resource agent script. No action planned for db2inst1 on host-srv-2.
REF 7: Indicates that Pacemaker will 'Promote' the standby database. The promote action in the db2hadr script will issue takeover by force peer window on the standby database. Meanwhile, the database on host-srv-1 will be stopped "due to node availability."
-
- Q: Why is Pacemaker issuing promote and stop of the database when it hasn't even detected that the database is offline via the db2hadr resource monitor?
-
- A: The HADR resource model has a location constraint for the HADR database resource that checks a CIB (Cluster Information Base) value set by the db2inst resource agent. When the instance resource monitor detected the instance had failed, it updated the CIB attribute value resulting in a negative INFINITY allocation score which will cause Pacemaker to 'stop' the database on host-srv-1 due to node availability and promote the database on host-srv-2.
The pacemaker-controld process will start coordinating execution of the planned actions across the cluster.
The following log points demonstrate the DC host coordinating execution of the planned actions on the local and remote host.
These log points correspond to steps 5/6 in the pacemaker event loop discussed above. Note that there is a lot of 'noise' being logged by pacemaker-based be at the same time as pacemaker-controld coordinates these actions. They have not been included in the following excerpt. Generally, you can ignore the pacemaker-based & pacemaker-attrd so long as these daemons are not explicitly logging errors in the pacemaker.log.
Examining the log on host-srv-1 we can see that many of the actions such as stopping the instance, or demoting the primary database were successful.
// /var/log/pacemaker/pacemaker.log on host-srv-1
// REF 1 – pacemaker-controld requests stop operation of the local Db2 instance
Oct 20 10:08:36.754 host-srv-1 pacemaker-controld [1244] (do_lrm_rsc_op) notice: Requesting local execution of stop operation for db2_host-srv-1_db2inst1_0 on host-srv-1 | transition_key=6:5964:0:f6e85835-5876-4567-aa53-d0f65b9cebd0 op_key=db2_host-srv-1_db2inst1_0_stop_0
<...>
// REF 2 – pacemaker-execd responds and executes the stop action via the db2inst resource agent.
Oct 20 10:08:36.755 host-srv-1 pacemaker-execd [1241] (log_execute) info: executing - rsc:db2_host-srv-1_db2inst1_0 action:stop call_id:37
<...>
// REF 3 – In parallel, pacemaker-controld also requests to ‘demote’ the primary database resource.
Oct 20 10:08:36.756 host-srv-1 pacemaker-controld [1244] (do_lrm_rsc_op) notice: Requesting local execution of demote operation for db2_db2inst1_db2inst1_HADRDB on host-srv-1 | transition_key=19:5964:0:f6e85835-5876-4567-aa53-d0f65b9cebd0 op_key=db2_db2inst1_db2inst1_HADRDB_demote_0
// REF 4 - pacemaker-execd responds and executes the demote action via the db2hadr resource agent.
Oct 20 10:08:36.757 host-srv-1 pacemaker-execd [1241] (log_execute) info: executing - rsc:db2_db2inst1_db2inst1_HADRDB action:demote call_id:39
<...>
// REF 5 – The db2inst resource agent is executing the stop action for the Db2 instance on host-srv-1.
Oct 20 10:08:36 db2inst(db2_host-srv-1_db2inst1_0)[673804]: INFO: stop: 546: db2inst1: db2inst_stop() entry. ATTRNAME="db2inst-host-srv-1_db2inst1_0", instHome="/home/db2inst1", dbPartNum="dbPartNum".
<...>
// REF 6 – The db2hadr resource agent is issuing a demote. The error below indicates that the instance is down, but does not cause issue for the demote
Oct 20 10:08:37 db2hadr(db2_db2inst1_db2inst1_HADRDB)[673805]: INFO: demote: 1054: db2inst1: 0: HADRDB: db2hadr_demote() entry. db="HADRDB".
Oct 20 10:08:37 db2hadr(db2_db2inst1_db2inst1_HADRDB)[673805]: ERROR: demote: 493: No db2sysc process detected in ps output
Oct 20 10:08:37 db2hadr(db2_db2inst1_db2inst1_HADRDB)[673805]: ERROR: demote: 735: db2inst1: 0: HADRDB: Instance is not up. db2hadr_instance_monitor() failed with rc=7, db2hadr_monitor() exit with rc=7.
<...>
// REF 7 – Demote of the primary completes successfully.
Oct 20 10:08:37 db2hadr(db2_db2inst1_db2inst1_HADRDB)[673805]: INFO: demote: 1062: db2inst1: 0: HADRDB: db2hadr_demote() exit with rc=0.
Oct 20 10:08:37.330 host-srv-1 pacemaker-execd [1241] (log_finished) info: db2_db2inst1_db2inst1_HADRDB demote (call 39, PID 673805) exited with status 0 (execution time 574ms)
Oct 20 10:08:37.331 host-srv-1 pacemaker-controld [1244] (log_executor_event) notice: Result of demote operation for db2_db2inst1_db2inst1_HADRDB on host-srv-1: ok | CIB update 55, graph action confirmed; call=39 key=db2_db2inst1_db2inst1_HADRDB_demote_0 rc=0
<...>
// REF 8 – Stop of the instance completes successfully.
Oct 20 10:08:38 db2inst(db2_host-srv-1_db2inst1_0)[673804]: INFO: stop: 588: db2inst1: Partition "0" already stopped. db2inst_stop() exit with rc=0.
Oct 20 10:08:39.004 host-srv-1 pacemaker-execd [1241] (log_finished) info: db2_host-srv-1_db2inst1_0 stop (call 37, PID 673804) exited with status 0 (execution time 2.249s)
Oct 20 10:08:39.005 host-srv-1 pacemaker-controld [1244] (log_executor_event) notice: Result of stop operation for db2_host-srv-1_db2inst1_0 on host-srv-1: ok | CIB update 56, graph action confirmed; call=37 key=db2_host-srv-1_db2inst1_0_stop_0 rc=0
The above logs illustrate the relationship between pacemaker-controld, pacemaker-execd and the resource agent scripts.
References 1, 2, 5, 8, show pacemaker-controld requesting to stop the Db2 instance, the stop being kicked off by pacemaker-execd, and the script itself executing the stop function for the instance successfully, which is reported back up the chain through pacemaker-execd and pacemaker-controld.
References 3, 4, 6, and 7, show a similar story for the HADR database resource.
Note that while there is an error reported during the demote operation, the operation is still expected in this scenario to return successfully. The error indicates that the Db2 instance that the database belongs to is not running. During a monitor operation on the primary, such an error would be a reason to perform takeover to standby (hence the error level log). However, since a demote operation is often executed as part of the process to takeover in response to an instance crash, its not unexpected that the instance is not running.
Returning to normal state
As Pacemaker attempts to bring resources back to their nominal state, it may need to abort and recalculate the transitions several times for different reasons including the following.
- An action executed returns an unexpected return code (RC).
- Example: Pacemaker attempted to promote the standby, but HADR takeover failed causing the promote action to fail.
- Additional resource failures detected.
- Example: Suppose we killed the instance on host-srv-2 a couple seconds after killing the instance on host-srv-1.
- Changes in node availability (quorum changes).
- Example: Suppose we reboot host-srv-1 a couple seconds after killing the instance on host-srv-1. This would cause host-srv-2 to become the DC host, so we would need to look at its Pacemaker log for the new pacemaker-schedulerd calculation.
- Other CIB changes resulting from script execution.
In any of the above, pacemaker will need to recalculate the transition to determine how to handle the new failures, or cluster state.
Of course, recalculating the transition several times can introduce quite a bit of variation between iterations of the exact same scenario. Ultimately, we expect that Pacemaker will successfully promote the primary database and bring back the failed instance. Even in the case that some intermittent issue on the host prevents Pacemaker from bringing the instance back online, Pacemaker will continue to try until it is eventually successful.
In cases where Pacemaker fails to promote the standby, its likely more productive to work backwards through the Pacemaker logs. In this case Pacemaker does as expected, however for the sake of brevity we will use a similar approach.
Eventually we see pacemaker-schedulerd log a healthy cluster status on the DC host.
Oct 20 10:10:37.495 host-srv-2 pacemaker-controld [1234] (crm_timer_popped) info: Cluster Recheck Timer just popped | input=I_PE_CALC time=60000ms
Oct 20 10:10:37.495 host-srv-2 pacemaker-controld [1234] (do_state_transition) notice: State transition S_IDLE -> S_POLICY_ENGINE | input=I_PE_CALC cause=C_TIMER_POPPED origin=crm_timer_poppedOct 20 10:10:37.495 host-srv-2 pacemaker-controld [1234] (do_state_transition) info: Progressed to state S_POLICY_ENGINE after C_TIMER_POPPED
Oct 20 10:10:37.515 host-srv-2 pacemaker-schedulerd[1233] (determine_online_status) info: Node host-srv-2 is online
Oct 20 10:10:37.515 host-srv-2 pacemaker-schedulerd[1233] (determine_online_status) info: Node host-srv-1 is online
Oct 20 10:10:37.517 host-srv-2 pacemaker-schedulerd[1233] (pcmk__set_instance_roles) info: Promoting db2_db2inst1_db2inst1_HADRDB:0 (Master host-srv-2)
Oct 20 10:10:37.517 host-srv-2 pacemaker-schedulerd[1233] (pcmk__set_instance_roles) info: db2_db2inst1_db2inst1_HADRDB-clone: Promoted 1 instances of a possible 1
// REF 1
Oct 20 10:10:37.518 host-srv-2 pacemaker-schedulerd[1233] (rsc_action_default) info: Leave db2_host-srv-1_eth0 (Started host-srv-1)
Oct 20 10:10:37.518 host-srv-2 pacemaker-schedulerd[1233] (rsc_action_default) info: Leave db2_host-srv-2_eth0 (Started host-srv-2)
Oct 20 10:10:37.518 host-srv-2 pacemaker-schedulerd[1233] (rsc_action_default) info: Leave db2_host-srv-1_db2inst1_0 (Started host-srv-1)
Oct 20 10:10:37.518 host-srv-2 pacemaker-schedulerd[1233] (rsc_action_default) info: Leave db2_host-srv-2_db2inst1_0 (Started host-srv-2)
Oct 20 10:10:37.518 host-srv-2 pacemaker-schedulerd[1233] (rsc_action_default) info: Leave db2_db2inst1_db2inst1_HADRDB:0 (Master host-srv-2)
Oct 20 10:10:37.518 host-srv-2 pacemaker-schedulerd[1233] (rsc_action_default) info: Leave db2_db2inst1_db2inst1_HADRDB:1 (Slave host-srv-1)
Oct 20 10:10:37.518 host-srv-2 pacemaker-schedulerd[1233] (pcmk__log_transition_summary) notice: Calculated transition 5972, saving inputs in /var/lib/pacemaker/pengine/pe-input-71.bz2
Oct 20 10:10:37.518 host-srv-2 pacemaker-schedulerd[1233] (handle_pecalc_op) info: Input has not changed since last time, not saving to disk
As expected, Pacemaker brought the primary database back online, in this case via a promote action (executes `takeover by force peer window only`) on the standby database and brought the instance we killed on host-srv-1 back online.
Searching backwards through the Pacemaker log we can find the log entries relevant to the successful takeover for the standby to primary database on host-srv-2.
// The following section again illustrates the call sequence controld -> execd -> resource agent and back.
Oct 20 10:08:39.033 host-srv-2 pacemaker-controld [1234] (te_rsc_command) notice: Initiating promote operation db2_db2inst1_db2inst1_HADRDB_promote_0 locally on host-srv-2 | action 14
Oct 20 10:08:39.033 host-srv-2 pacemaker-controld [1234] (do_lrm_rsc_op) notice: Requesting local execution of promote operation for db2_db2inst1_db2inst1_HADRDB on host-srv-2 | transition_key=14:5965:0:f6e85835-5876-4567-aa53-d0f65b9cebd0 op_key=db2_db2inst1_db2inst1_HADRDB_promote_0
Oct 20 10:08:39.034 host-srv-2 pacemaker-based [1229] (cib_process_request) info: Forwarding cib_modify operation for section status to all (origin=local/crmd/6030)
Oct 20 10:08:39.034 host-srv-2 pacemaker-execd [1231] (log_execute) info: executing - rsc:db2_db2inst1_db2inst1_HADRDB action:promote call_id:28
<...>
Oct 20 10:08:39 db2hadr(db2_db2inst1_db2inst1_HADRDB)[2058667]: INFO: promote: 968: db2inst1: 0: HADRDB: db2hadr_promote() entry. db="HADRDB", Master score="8000".
<...>
Oct 20 10:08:39 db2hadr(db2_db2inst1_db2inst1_HADRDB)[2058667]: INFO: promote: 983: db2inst1: 0: HADRDB: 1: The database has HADR status STANDBY/DISCONNECTED_PEER/DISCONNECTED and is being considered for promotion.
Oct 20 10:08:39 db2hadr(db2_db2inst1_db2inst1_HADRDB)[2058667]: INFO: promote: 285: set_cib_value called by 'db2hadr_promote' at 1013: Setting cib attribute db2hadr-db2inst1_db2inst1_HADRDB_takeover to 1 on host 'host-srv-2'
<...>
Oct 20 10:08:42 db2hadr(db2_db2inst1_db2inst1_HADRDB)[2058667]: INFO: promote: 285: set_cib_value called by 'db2hadr_promote' at 1016: Setting cib attribute db2hadr-db2inst1_db2inst1_HADRDB_takeover to 0 on host 'host-srv-2'
<...>
Oct 20 10:08:42 db2hadr(db2_db2inst1_db2inst1_HADRDB)[2058667]: INFO: promote: 1021: db2inst1: 0: HADRDB: Debug data: "DB20000I The TAKEOVER HADR ON DATABASE command completed successfully.". db2hadr_promote() exit with rc=0.
Oct 20 10:08:42.620 host-srv-2 pacemaker-based [1229] (cib_file_write_with_digest) info: Wrote version 1.164.0 of the CIB to disk (digest: 65f8beb03173479148279cdd44008632)
Oct 20 10:08:42.625 host-srv-2 pacemaker-execd [1231] (log_finished) info: db2_db2inst1_db2inst1_HADRDB promote (call 28, PID 2058667) exited with status 0 (execution time 3.592s)
Oct 20 10:08:42.626 host-srv-2 pacemaker-controld [1234] (log_executor_event) notice: Result of promote operation for db2_db2inst1_db2inst1_HADRDB on host-srv-2: ok | CIB update 6031, graph action confirmed; call=28 key=db2_db2inst1_db2inst1_HADRDB_promote_0 rc=0
Similarly, we can also find the instance restarted successfully, and the database was reintegrated as standby on host-srv-1.
Oct 20 10:08:39.034 host-srv-1 pacemaker-controld [1244] (do_lrm_rsc_op) notice: Requesting local execution of start operation for db2_host-srv-1_db2inst1_0 on host-srv-1 | transition_key=8:5965:0:f6e85835-5876-4567-aa53-d0f65b9cebd0 op_key=db2_host-srv-1_db2inst1_0_start_0
Oct 20 10:08:39.035 host-srv-1 pacemaker-based [1239] (cib_process_request) info: Forwarding cib_modify operation for section status to all (origin=local/crmd/57)
Oct 20 10:08:39.035 host-srv-1 pacemaker-execd [1241] (log_execute) info: executing - rsc:db2_host-srv-1_db2inst1_0 action:start call_id:40
<...>
Oct 20 10:08:39 db2inst(db2_host-srv-1_db2inst1_0)[674036]: INFO: start: 442: db2inst1: db2inst_start() entry.
Oct 20 10:08:39 db2inst(db2_host-srv-1_db2inst1_0)[674036]: INFO: start: 128: Setting cib attribute db2inst-host-srv-1_db2inst1_0_start to 1 on local host
<...>
Oct 20 10:08:39 db2inst(db2_host-srv-1_db2inst1_0)[674036]: WARNING: start: 681: ps did not list any process for db2sysc on node 0 after 5 retries. db2inst_monitor() exit with rc=7.
<...>
Oct 20 10:08:39 db2inst(db2_host-srv-1_db2inst1_0)[674036]: INFO: start: 218: db2inst1: Attempting to start partition(0) via db2gcf...
<...>
Oct 20 10:08:41 db2inst(db2_host-srv-1_db2inst1_0)[674036]: INFO: start: 221: db2inst1: Start via db2gcf returned rc=0.
<...>
Oct 20 10:08:42 db2inst(db2_host-srv-1_db2inst1_0)[674036]: INFO: start: 259: db2inst1: activateDatabases() entry.
<...>
Oct 20 10:08:43 db2inst(db2_host-srv-1_db2inst1_0)[674036]: INFO: start: 270: db2inst1: Database: HADRDB
Oct 20 10:08:43 db2inst(db2_host-srv-1_db2inst1_0)[674036]: INFO: start: 306: db2inst1: cib_attr: db2hadr-db2inst1_db2inst1_HADRDB_reint - cib_value: 1
Oct 20 10:08:43 db2inst(db2_host-srv-1_db2inst1_0)[674036]: INFO: start: 311: db2inst1: Forcing apps off 'HADRDB' before reintegration..
Oct 20 10:08:46 db2inst(db2_host-srv-1_db2inst1_0)[674036]: INFO: start: 318: db2inst1: HADR database 'HADRDB' successfully reintegrated as standby.
Oct 20 10:08:46 db2inst(db2_host-srv-1_db2inst1_0)[674036]: INFO: start: 128: Setting cib attribute db2hadr-db2inst1_db2inst1_HADRDB_reint to 0 on local host
<...>
Oct 20 10:08:46 db2inst(db2_host-srv-1_db2inst1_0)[674036]: INFO: start: 433: db2inst1: activateDatabases() exit.
Oct 20 10:08:46 db2inst(db2_host-srv-1_db2inst1_0)[674036]: INFO: start: 128: Setting cib attribute db2inst-host-srv-1_db2inst1_0_start to 0 on local host
<...>
Oct 20 10:08:46 db2inst(db2_host-srv-1_db2inst1_0)[674036]: INFO: start: 536: db2inst1: db2inst_start() exit with rc=0.
<...>
Oct 20 10:08:46.944 host-srv-1 pacemaker-execd [1241] (log_finished) info: db2_host-srv-1_db2inst1_0 start (call 40, PID 674036) exited with status 0 (execution time 7.909s)
Oct 20 10:08:46.989 host-srv-1 pacemaker-controld [1244] (wait_for_sync_result) info: db2inst_meta-data_0[674824] exited with status 0
Oct 20 10:08:46.989 host-srv-1 pacemaker-controld [1244] (log_executor_event) notice: Result of start operation for db2_host-srv-1_db2inst1_0 on host-srv-1: ok | CIB update 60, graph action confirmed; call=40 key=db2_host-srv-1_db2inst1_0_start_0 rc=0
From the Pacemaker perspective the cluster is back to its nominal healthy state.
So, what are the next steps? We can now revisit the decision to engage IBM support for RCA or continue our own analysis by looking at the system and Db2 diagnostics (or in this case, the shell history which will show the system admin killed the db2sysc process 😊). Our analysis of the Pacemaker logs alone is enough to provide a summary timeline of the events as often required by Db2 support analysts. However, performing a preliminary check of the system logs or Db2 diagnostics is sometimes enough to complete RCA without engaging support. For example, if the Linux Out-of-memory killer had killed db2sysc it would be logged in the system logs.
The Pacemaker logs will vary from case to case depending on the type of failure, and the order of operations Pacemaker chose to recover the cluster. A loss of network communication between the hosts will look very different compared to a db2sysc crash for example. The good news is that the key concepts discussed in this post will always serve to guide you through the Pacemaker logs.
This wraps up the penultimate chapter of ‘The Book of Pacemaker’. Stay tuned for the final chapter to wrap up the series!
Gerry joined IBM in 2015, and has been an active developer on the Db2 pureScale and High Availability team since 2017. In 2019, he joined a highly focused team investigating a variety of cluster manager technologies, which went on to build the early prototype for Automated HADR with Pacemaker. In 2020 he took on the role of technical lead for integrating Pacemaker into the Db2 engine and continues today to work with the team in order to improve the solution.